Navigating Through the Calcium and Phosphate Solubility Curves of Parenteral Nutrition
The Calcium Phosphate Solubility Issue

When I first launched my pharmacy career at a tiny hospital pharmacy, I once caused calcium and phosphate to precipitate in a bag of Parenteral Nutrition (PN). We were in the middle of a drug shortage, and I had blindly substituted calcium gluconate with calcium chloride. Although it took less than a minute for the solution to form into a sea of tiny crystals, my journey toward understanding the chemistry behind it was a longer route.
At that point in my practice, my only method for assessing solubility was to calculate the ratio of the phosphate and calcium constituents to the final volume of the formulation. Unfortunately, this ratio did not detect that calcium chloride dissociated more extensively than calcium gluconate. A calcium phosphate ratio also doesn’t account for amino acid and dextrose concentrations, both of which influence the final pH, which can further drive a PN solution toward precipitation.
Solubility Curves
Today, however, there are published solubility curves to help assess calcium and phosphate solubility within a larger landscape of parenteral ingredients. To create these curves, researchers conduct experiments on representative formulations and then plot the maximum concentrations of calcium gluconate and phosphate salts that remain dissolved in their solutions.
Because of the limited number of experimental studies, a solubility curve can only approximate an actual PN. An appropriate curve is one that comes closest to the PN amino acid and dextrose concentrations. The amino acid component is especially important because it has a large net effect on the final pH. The brand of the amino acids used in the solubility study should always be the same as the one used during compounding.
It is often helpful to think of a solubility curve as an area map having an L-shaped border. To locate your PN order on the map, plot the mEqs of calcium gluconate per liter on the vertical axis and plot the mmoles of phosphates per liter on the horizontal axis. Formulations that plot further below and to the left of the solubility border, are less likely to precipitate. Formulations that approach and cross over to the right have a higher risk of precipitation.
As you further explore the solubility curves, you will notice that higher concentrations of amino acids and dextrose can push the solubility border further to the right, increasing the solution’s capacity for keeping calcium and phosphate in the solution. The same is true if cysteine HCL is added to the formulation. These shifts illustrate how pH-lowering ingredients expand the compatibility range of the calcium and phosphate concentrations.
The influence of pH is especially notable on the injectable phosphates component, which is only available as mixtures of monobasic and dibasic phosphate salts in the United States. In an aqueous solution, the phosphates will dissociate into mixtures of monobasic and dibasic phosphate anions, available to form calcium phosphate salts in the presence of calcium cations. In the monobasic phosphate pathway, which predominates at a lower pH, the resulting calcium phosphate salt is sixty times more soluble than the one produced in the dibasic pathway.1
Although solubility curves can help to map out these relationships between concentration, pH, and water solubility, they can never perfectly predict precipitation. Experimental conditions only approximate real life. Differences in time and temperature can cause outcomes to stray from one’s expectations. Administration sets for parenteral nutrition, therefore, should always contain in-line filters, to prevent any unseen precipitation from finding its way into a patient’s pulmonary blood stream.
Order-screening tools can guide prescribers to help them avoid risks associated with parenteral nutrition. CAPSLinksm, a PN-ordering system used by CAPS® customers, includes a calcium-phosphate-curve-window, providing a clearer view of a formulation’s solubility limits. In the following section, we share general guidelines for using the CAPSLink solubility-curve-window, to help users arrive at safer decisions.
General Guidelines for CAPSLink(sm) Solubility-Curve-Window
1. If you wish to first view the calcium-phosphate ratio, click the “order summary” link above the order displayed in CAPSLink
2. To open the curves window, click “CAPO4 curves” link above the displayed order.
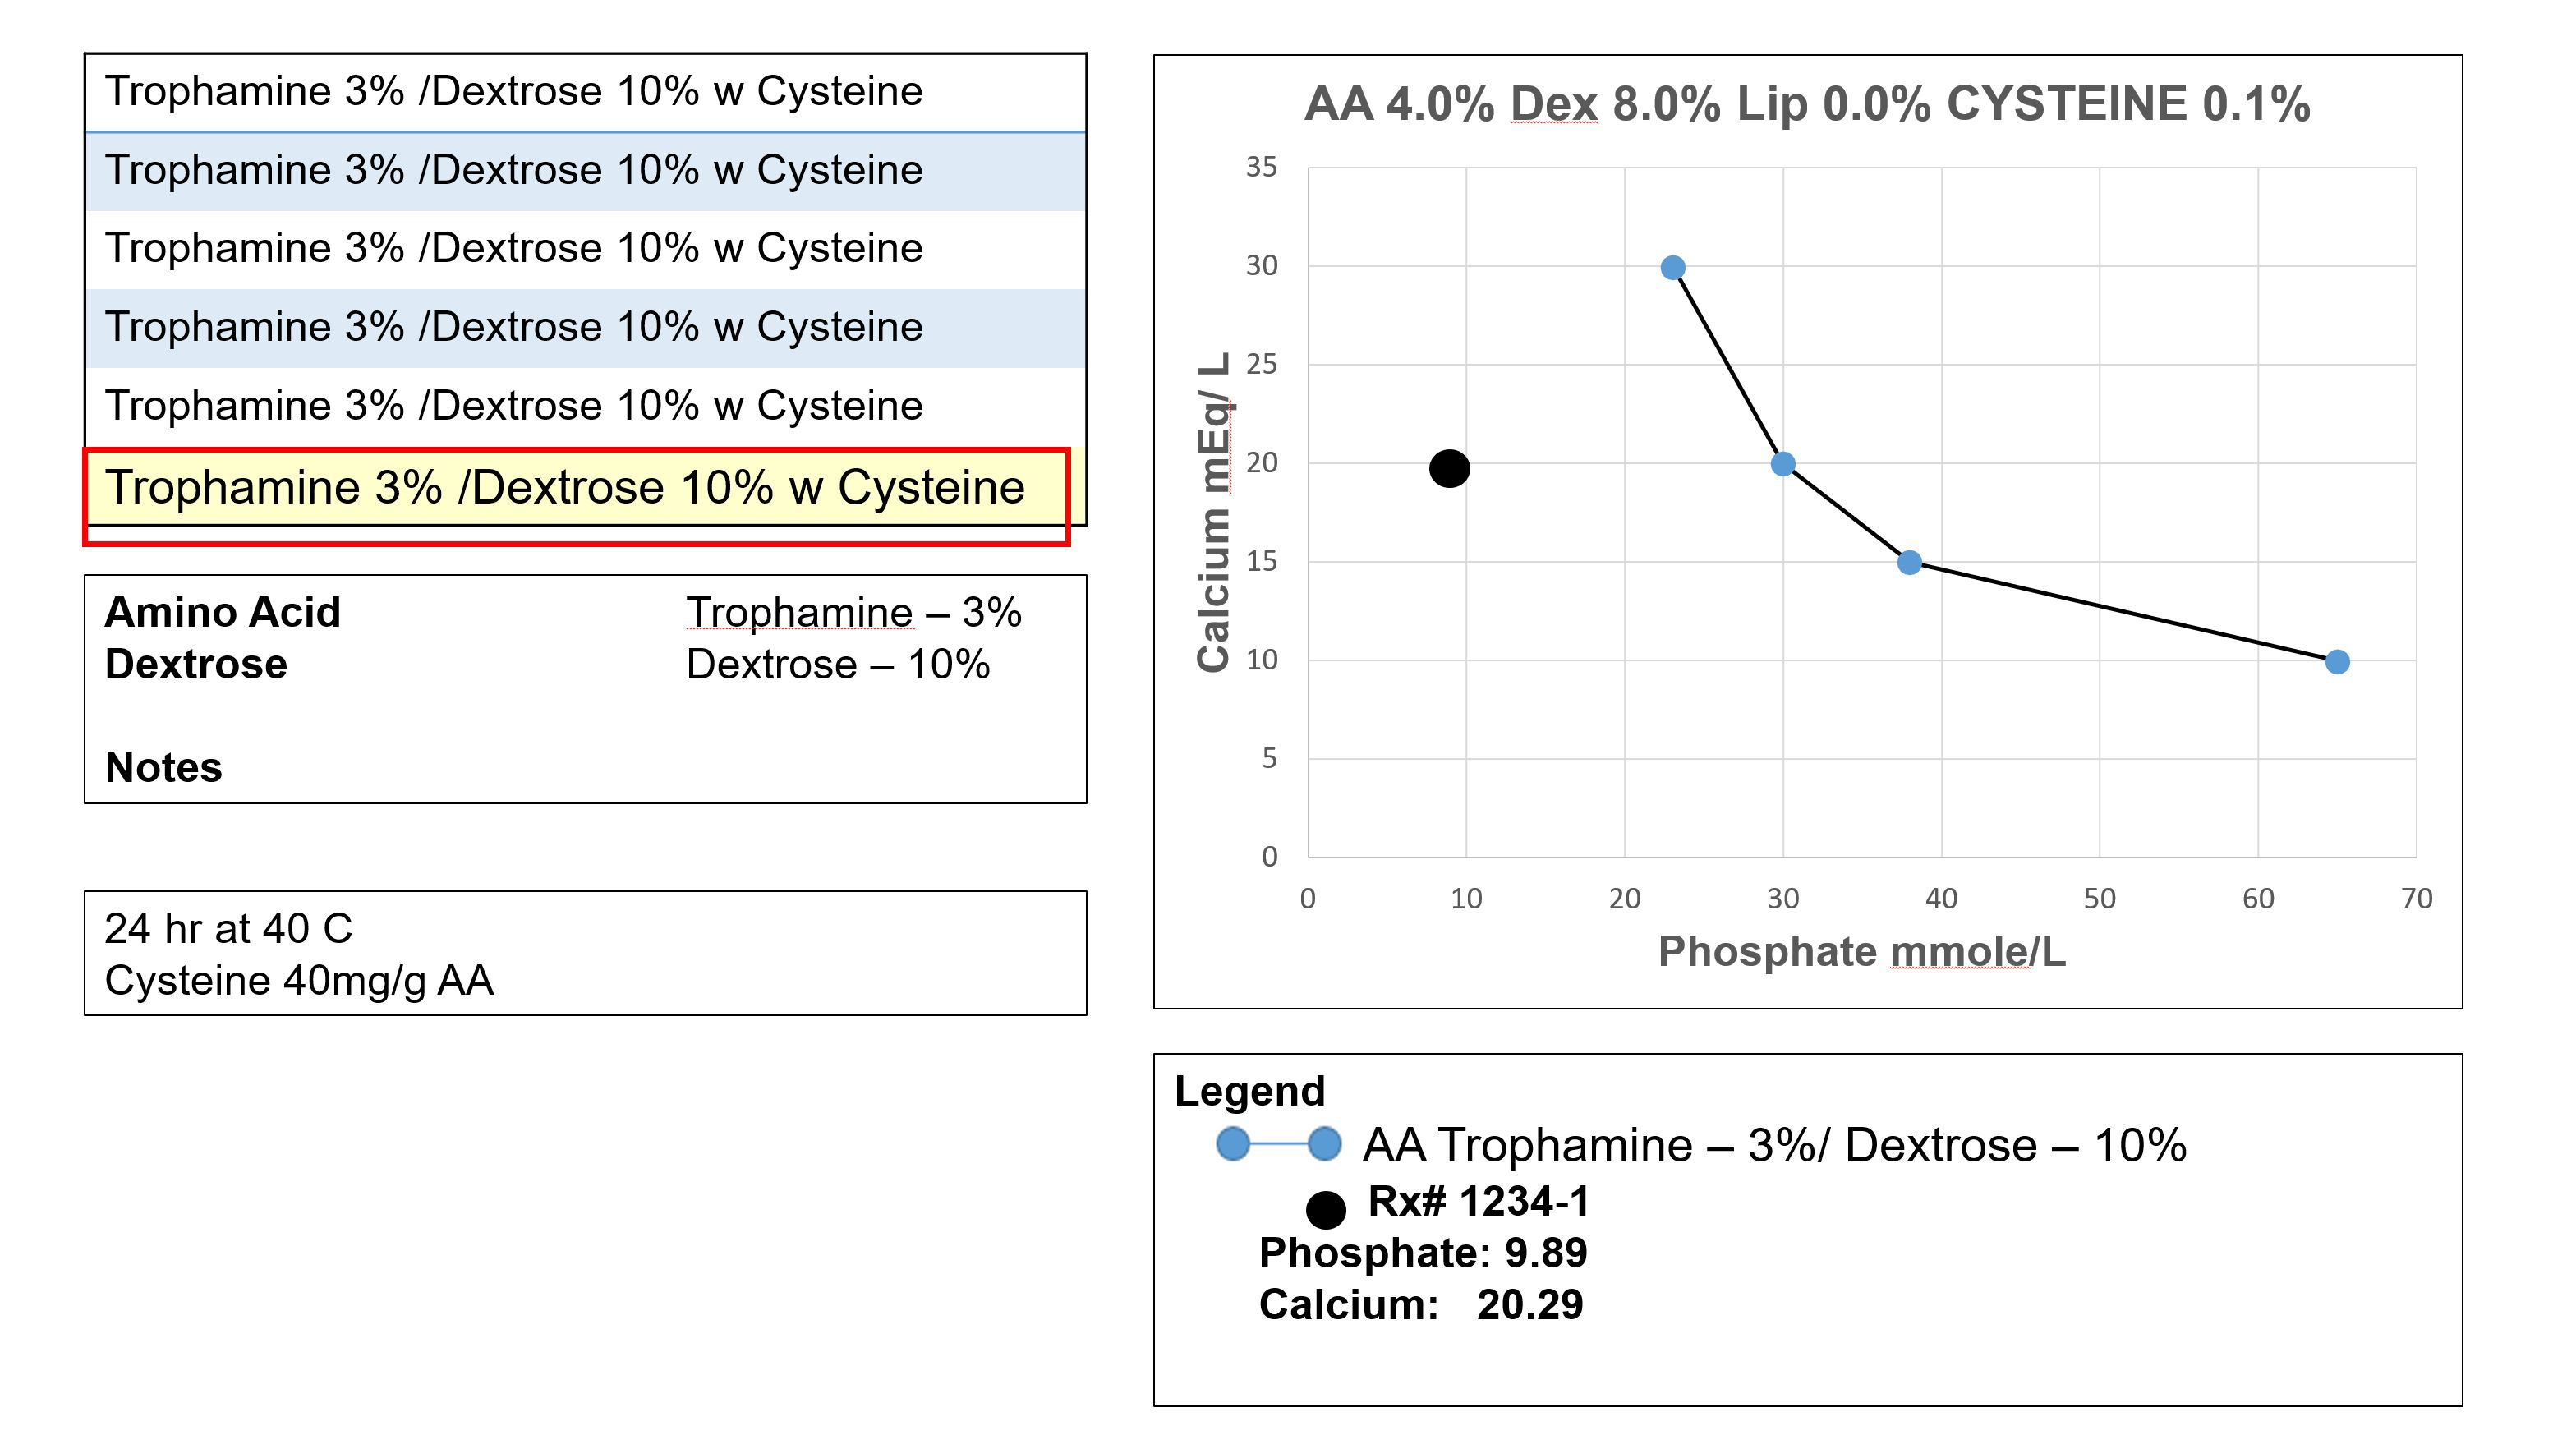
3. After opening the curves window, the macro-nutrient concentrations of the displayed order are listed in the graph title. Because the actual order in the example also contains cysteine, a cysteine concentration is also listed in the graph title.
4. The available calcium phosphate solubility curves are listed on the left side of the curves window.
5. We selected a curve based on 3% Trophamine and 10% Dextrose. This best approximates the macro-nutrient concentrations and matches the brand of amino acids in the actual order. Cysteine is also included because every 160mg of cysteine HCl delivers 1 mmole of HCl, to help lower the total pH of the formulation.
6. After making a selection, the curve will overlay over the graph.
7. Using the actual order’s calcium and phosphate concentrations as coordinates, the actual order plots far to the left of the curve, in the area less likely for precipitation.
8. Additional information about the solubility curve is listed in the notes box in the bottom-left corner of the window. Here you will find the curve reference.
NOTE: Experimental formulations used to produce the curves will never exactly duplicate the actual order. The more they differ, the less certain the border between solubility and insolubility.
9. The experimental curves are also based on calcium gluconate as the source of calcium. (As an organic salt, calcium gluconate dissociates less extensively than inorganic calcium chloride).
10. The graph lists calcium and phosphate as final concentrations. Therefore, a controlled compounding process is critical to maintain maximum separation between the calcium and phosphate components.
NOTE: Remember that a precipitation can happen at any time. PN should always be infused through an administration set that contains an in-line filter.
Stay Ahead of the Curve

Enhancing operational, quality, and standardization initiatives in the hospital pharmacy is within your reach. Through CAPS Consulting, our team of pharmacy experts can help bring your sterile compounding program to the next level.
Elevate Your Sterile Compounding Program
The first step is simple. Connect with a sterile compounding consultant and find out how our programs can be customized to meet your needs.
References:
1 Newton, David W. and Driscoll, David F.; “Calcium and Phosphate Compatibility: Revisited Again”; Am J Health-Syst Pharm. 2008; 65:73-80 (H6)